Product overview
Forecast the day. Then check the forecast.
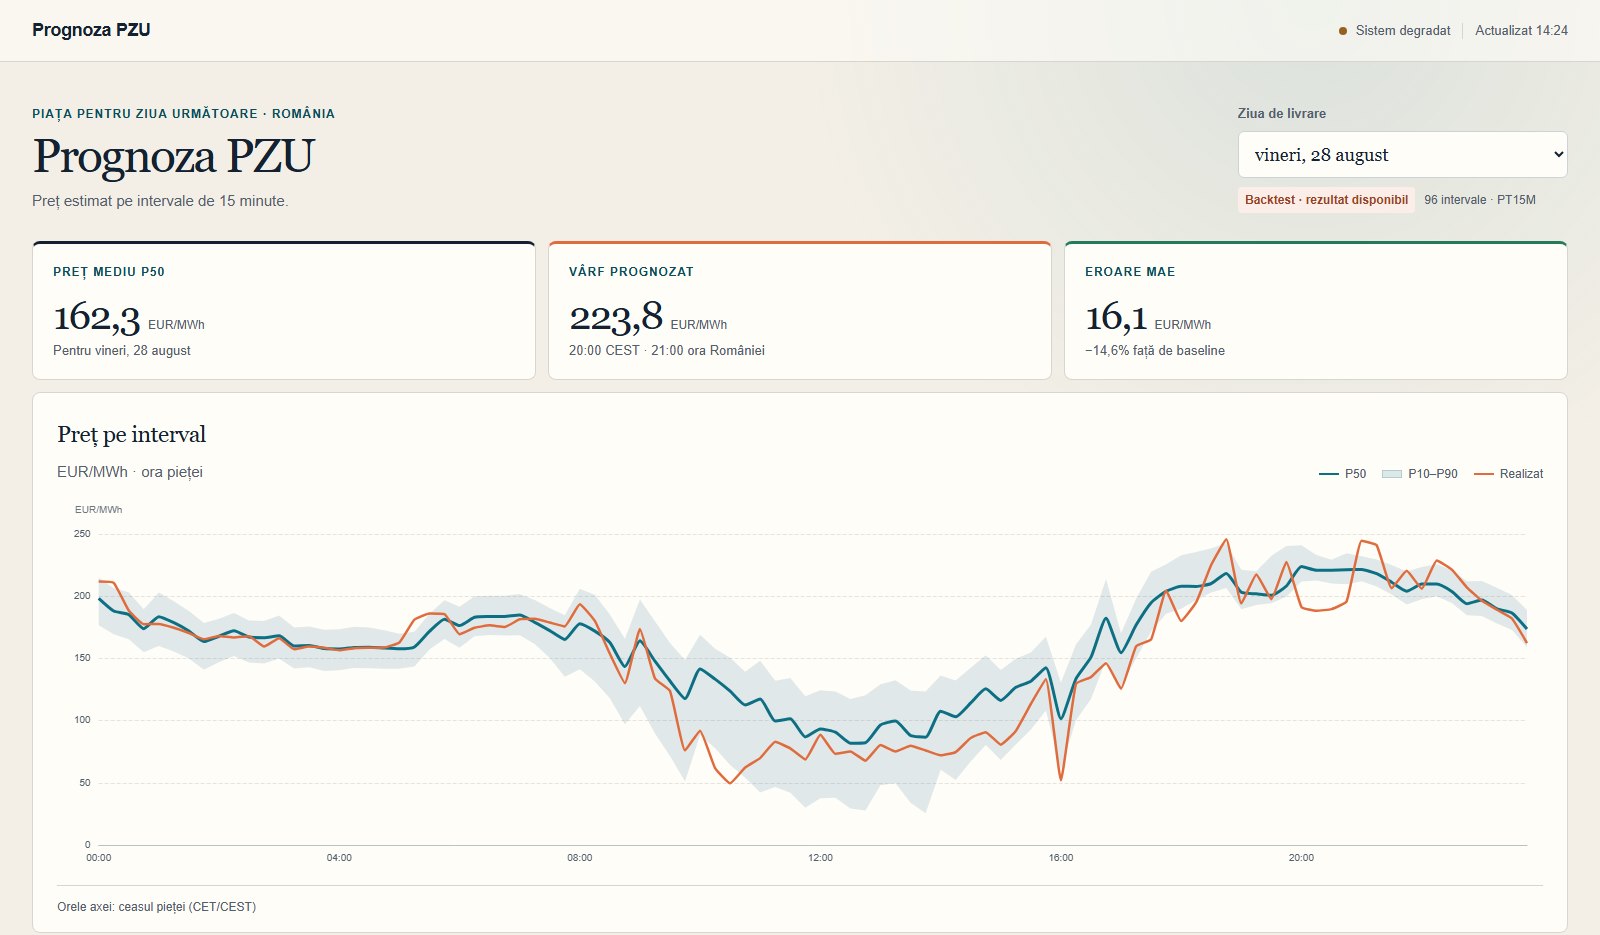
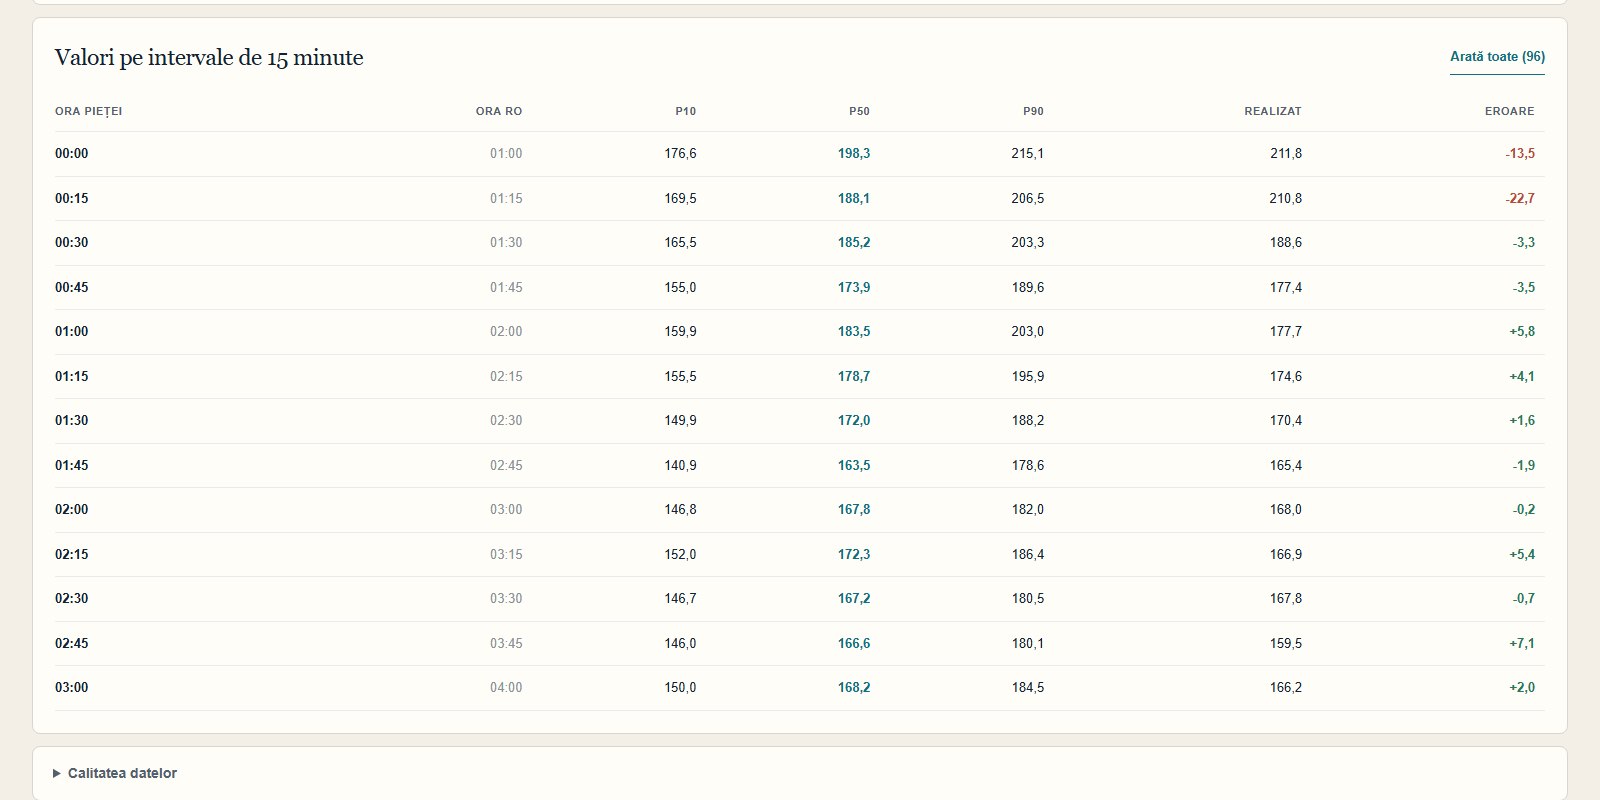
Every delivery day is published as 96 fifteen-minute intervals, each with a P50 estimate and a P10-P90 uncertainty band. A chart shows the shape of the day; a table shows the numbers behind it.
Once the market settles, realised prices are placed next to the forecast and every interval gets a signed error. The day is scored with MAE against a baseline, so accuracy is visible instead of assumed.
PT15MP10 / P50 / P90ENTSO-E 12.1.DBacktestingMAE vs baselineCET/CEST